Logistic Regression: From Linear Scores to Probabilities
Binary classification often needs two outputs: a probability and a decision. Logistic regression produces the probability; a threshold chosen for the use case turns it into a class. Treating those as the same step hides the trade-off between missed positives and false alerts.
Define the event and prediction window before fitting
Consider a banking campaign model that predicts whether an eligible customer will respond within the next 30 days. One row represents one customer at the decision date, features may use only information available before that date, and the target records a response inside the following 30-day window.
Without that cutoff, a feature created after the response can leak the answer into training data. The model may then score well offline while failing when it is used before the event occurs.
A linear model alone does not produce probabilities
Linear regression cannot guarantee an output between 0 and 1. Its fitted line is unbounded, and extreme observations can move a classification boundary in ways that have no probabilistic interpretation.
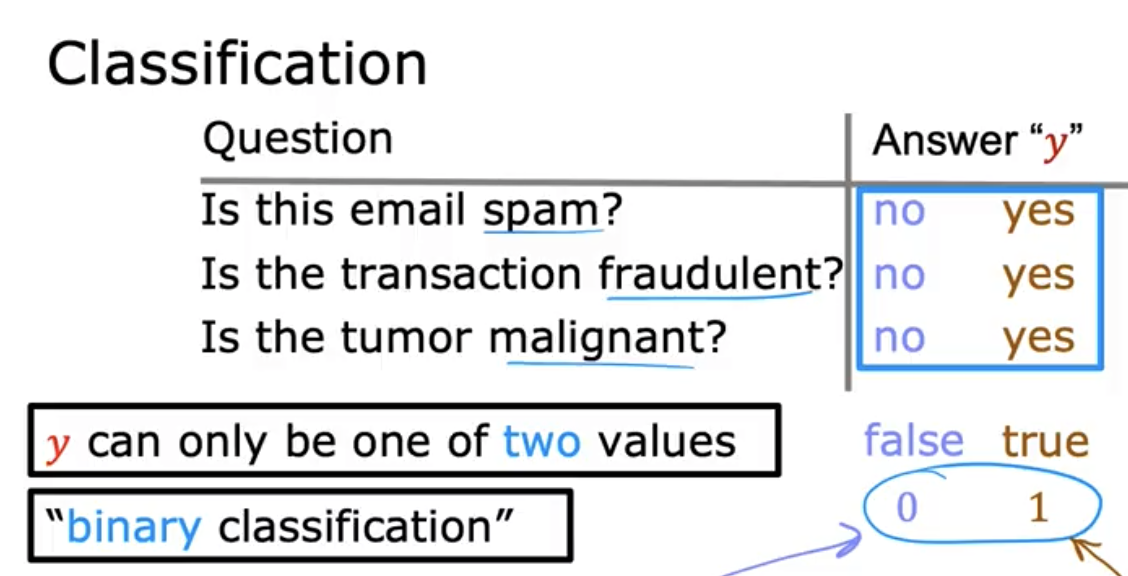
This is why logistic regression keeps a linear score but passes it through a sigmoid before making a binary prediction.
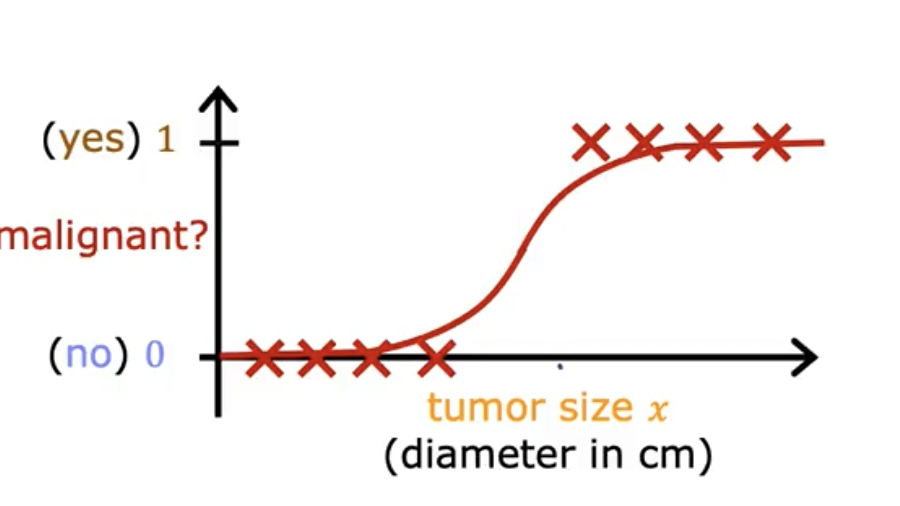
The sigmoid maps any linear score into (0, 1)
First calculate the linear score:
z = w · x + b
Then transform it with the sigmoid:
p = g(z) = 1 / (1 + e⁻ᶻ)
The input z can take any real value, while the output satisfies 0 < p < 1.
Logistic regression is linear in the log-odds
Rearranging the sigmoid gives:
w · x + b = log(p / (1 - p))
The ratio p / (1 - p) is the odds, and its logarithm is the logit or log-odds. Logistic regression therefore models a linear relationship between the input features and log-odds, not between the features and probability itself.
Cross-entropy measures the error between the predicted probability and the binary target. Its gradients provide the updates for w and b.
This linearity has a specific meaning: each feature has an additive effect on the log-odds. Logistic regression will not discover a curved relationship or an interaction unless that structure is included in the features.
Fit one-feature logistic regression from scratch
import math
import numpy as np

def predict(x, alpha, beta):
    # Clip z to prevent overflow when calculating exp, keeping output continuous
    z = alpha * x + beta
    z = max(min(z, 10), -10)  # clip between -10 and 10 for stability
    return 1.0 / (1.0 + math.exp(-z))

def logistic_regression_scratch(x, y, alpha_init=0, beta_init=0, learning_rate=0.01, epochs=101):
    alpha = alpha_init
    beta = beta_init

    n = len(y)

    for run in range(epochs):
        loss = 0
        update_alpha = 0
        update_beta = 0

        for i in range(n):
            z = alpha * x[i] + beta
            z = max(min(z, 10), -10) # clip to avoid overflow
            y_pred = 1 / (1 + np.exp(-z))  # sigmoid

            # cross-entropy loss
            loss += (-1/n) * (y[i] * np.log(y_pred + 1e-9) + (1 - y[i]) * np.log(1 - y_pred + 1e-9))

            # gradients
            update_alpha += (y_pred - y[i]) * x[i]
            update_beta += (y_pred - y[i])

        # Update weights
        alpha -= learning_rate * (update_alpha / n)
        beta  -= learning_rate * (update_beta / n)

        if run % 100 == 0:
            print(f"Epoch {run}: Loss = {loss:.4f}, alpha = {alpha:.4f}, beta = {beta:.4f}")

    return alpha, beta

def predict_scratch(x, alpha, beta, threshold=0.5):
    # Calculate probability and apply threshold for final class prediction
    prob = [1 / (1 + math.exp(-(ele * alpha + beta))) for ele in x]
    return [int(ele >= threshold) for ele in prob]

# Example usage (assuming x, y are defined)
# y_pred_all = [predict(xi, alpha, beta) for xi in x]
# print(y_pred_all)
The final predict_scratch function keeps probability and class prediction separate: the sigmoid produces a probability, while the threshold converts that probability into a class. Changing the threshold changes the predicted classes without refitting the logistic-regression coefficients.
A threshold is an operating decision, not a model constant
The default threshold of 0.5 is convenient, but it is not automatically appropriate. In the campaign example:
- A lower threshold selects more customers and may capture more responders, but it also spends campaign capacity on more non-responders.
- A higher threshold reduces the contacted population, but it may miss customers who would have responded.
The threshold should therefore be selected against the cost of contact, available campaign capacity, and the value of a response. Accuracy alone can be misleading when responders are rare; precision, recall, the precision–recall curve, and results at the actual contact budget are more informative.
Ranking and probability quality are different checks
A model may rank responders above non-responders while producing probabilities that are too high or too low. Discrimination metrics such as ROC AUC or precision–recall AUC evaluate ranking. Calibration checks whether customers scored near 0.20 respond at roughly a 20% rate.
This distinction matters whenever the score is used as an expected probability—for example, to compare expected campaign value with contact cost. A useful evaluation should also use a time-based or otherwise out-of-sample split that reproduces how the model will be applied.
Where logistic regression can fail
- A feature recorded after the prediction date creates leakage.
- Strong class imbalance makes accuracy look better than the model is.
- Unmodeled nonlinearities and interactions leave structure in the errors.
- Highly correlated features can make individual coefficients unstable even when predictions remain usable.
- A probability learned in one period may lose calibration when customer behavior or campaign policy changes.
Logistic regression is valuable because its score, probability, and decision threshold can be inspected separately. That advantage disappears if the target window, leakage rules, and operating threshold are left undefined.