K-Means in Banking: Useful for Profiles, Not Labels
K-means can divide customers into groups with similar features, but it does not discover objectively correct customer segments. In my banking work, its value has been narrower and more useful: it turns a large customer table into a small number of profiles that analysts and business teams can inspect.
The business question comes before the clusters
The use case starts with customers who have already purchased insurance. The question is not “Who will buy insurance?”—that would require a labeled, supervised-learning problem. The question is “What different customer profiles exist inside the insurance portfolio?”
K-means can reveal a profile such as customers over 35 with high assets under management and frequent medicine or medical-examination transactions. This can support portfolio analysis and a more concrete discussion with the business, but the algorithm does not explain why those customers bought insurance or prove that the profile will remain stable.
There is no known target label in this task. A cluster number such as 2 has no business meaning until we inspect the customers and features assigned to it.
One row must represent one customer over one fixed window
Before choosing K, the analysis needs a customer-level feature table. Each row represents one customer, and every behavioral feature must be calculated over the same observation window. Relevant features for this use case include:
- Age.
- Assets under management.
- Number or frequency of medicine-purchase transactions.
- Number or frequency of medical-examination transactions.
The observation window matters. A count over one month is not comparable with a count over twelve months, and mixing windows can create clusters that reflect feature construction rather than customer behavior.
Feature definitions also need to remain interpretable. If the business cannot explain what a high or low value means, it will be difficult to explain the resulting centroid.
Scaling decides what “similar customer” means
K-means usually relies on Euclidean distance. Without scaling, a monetary feature such as assets under management can dominate age or transaction frequency simply because it has a larger numeric range.
For this use case, the preparation step should therefore:
- Treat missing values consistently rather than allowing absence to become an accidental segment.
- Inspect highly skewed monetary and count features and apply a transformation when justified.
- Scale the final numeric features before calculating distances.
- Keep the transformation parameters so cluster profiles can later be translated back into business units.
This is not cosmetic preprocessing. Changing the scale changes the nearest centroid and can change the segment assigned to a customer.
K-means alternates assignment and centroid updates
Given N data points, K-means assigns them to K clusters according to their distance from the cluster centroids:
- Choose
K, the number of clusters. - Initialize
Kcentroids, often from selected data points. - Assign every point to its nearest centroid.
- Recalculate each centroid from the points assigned to that cluster.
- Repeat assignment and update until the assignments or centroids stop changing enough.
Because the initial centroids affect the final result, different initializations can produce different clusters. Running several initializations reduces the chance of reporting a poor local solution from one unlucky starting point.
Inertia cannot choose K by itself
The elbow curve uses within-cluster distance, commonly called inertia: the sum of squared distances from each point to its assigned centroid.
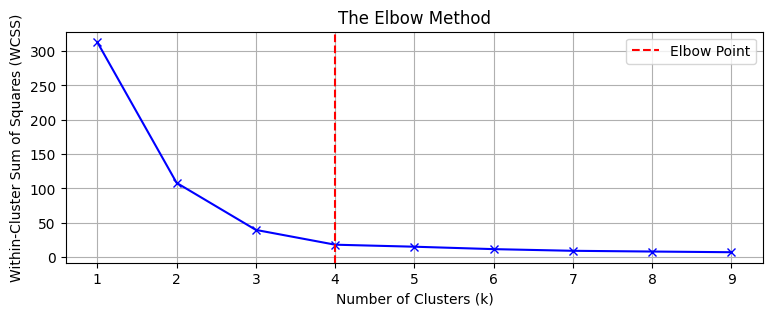
Increasing K gives the algorithm more centroids, so inertia cannot increase. The smallest inertia therefore does not identify the best K; choosing one cluster per customer would minimize it without producing a useful segmentation. The elbow is the point after which additional clusters reduce inertia only slightly, but the bend is not always unambiguous.
Silhouette checks separation as well as compactness
For point i, the silhouette value is:
s(i) = (b(i) - a(i)) / max(b(i), a(i))
a(i): average distance from pointito other points in its own cluster.b(i): lowest average distance from pointito points in another cluster.
The silhouette score is the average of s(i) across all points. A higher value means points are closer to their own cluster than to neighboring clusters.
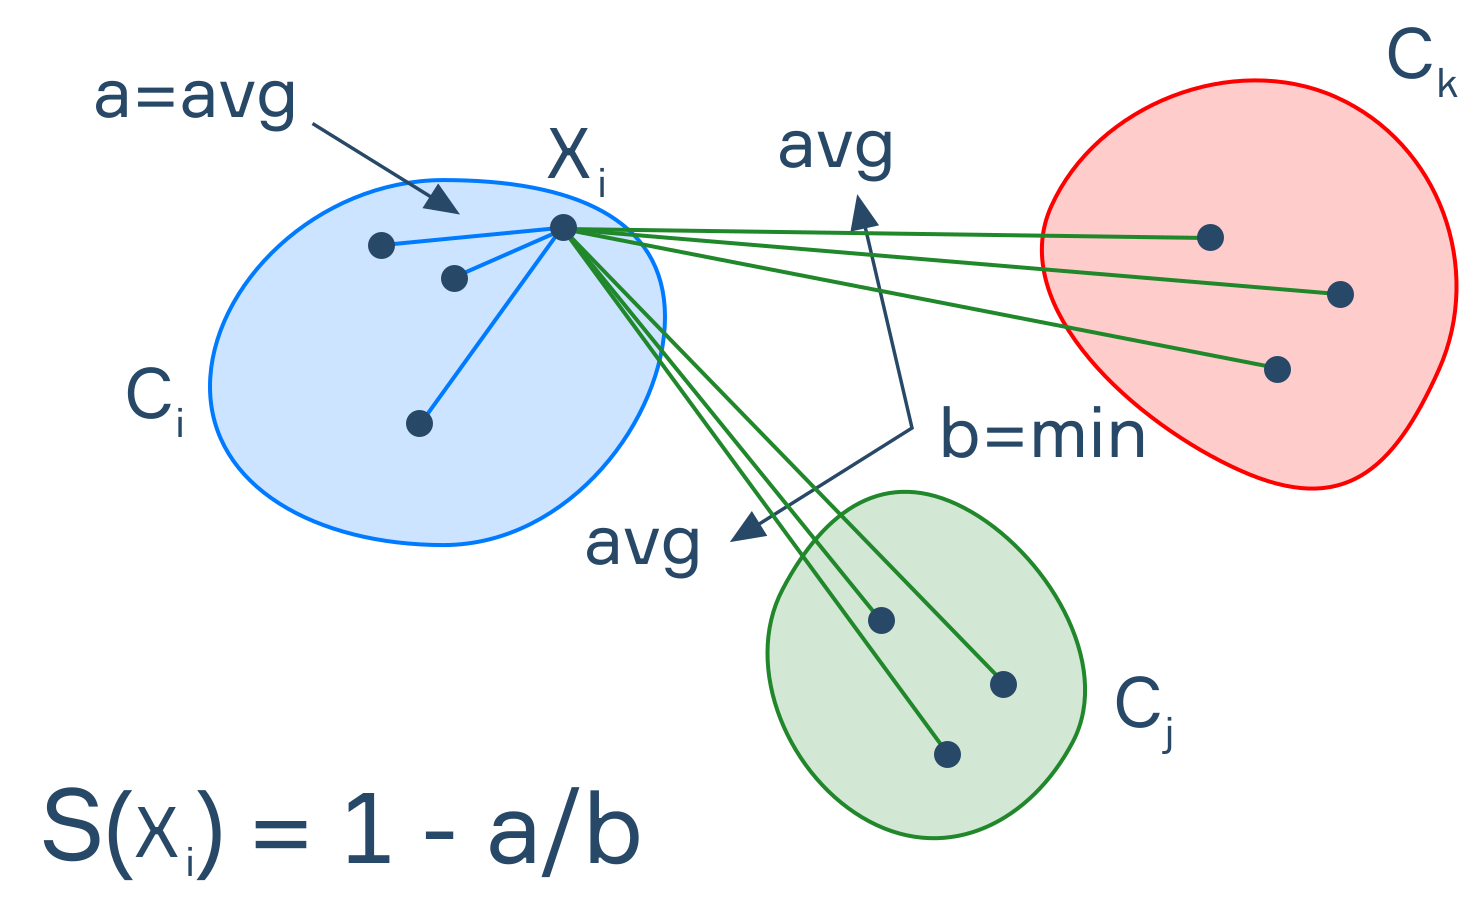
Unlike inertia, silhouette does not move in one guaranteed direction as K increases. It helps compare candidate values of K, but its highest value is not automatically the best business choice. A solution with slightly lower silhouette may be preferable if its profiles are stable, sufficiently large, and meaningfully different.
A useful cluster needs a profile, not just an ID
For each candidate value of K, I use the elbow and silhouette together, then build a profiling table. At minimum, that table should contain:
| Profile field | Question it answers |
|---|---|
| Customer count and share | Is the cluster large enough to matter? |
| Median age and assets under management | What does a typical customer in the cluster look like? |
| Medicine and medical-examination transaction frequency | Which behavior separates this cluster from the others? |
| Difference from the full portfolio | Is the profile distinctive or merely average? |
Centroids are calculated in the transformed feature space. For interpretation, the values should be converted back to understandable units where possible. The final names should describe the profile—such as “higher assets, frequent healthcare transactions”—rather than expose arbitrary labels such as “Cluster 2.”
Stability matters more than one attractive chart
A segmentation is difficult to use if its profiles change whenever the random seed or observation period changes. I therefore treat stability as a separate check:
- Run K-means with multiple initializations.
- Compare profiles across nearby values of
K. - Recalculate the segmentation on another observation window.
- Compare the profile characteristics rather than the numeric cluster IDs, because those IDs can be permuted between runs.
If a small change in the data produces entirely different profiles, the segmentation is describing a fragile partition rather than a repeatable customer pattern.
Where K-means can give the wrong picture
K-means works best when Euclidean distance is meaningful and clusters are reasonably compact. It becomes less reliable when:
- Outliers pull a centroid away from the typical customer.
- Clusters have very different sizes or densities.
- The underlying groups have irregular, non-spherical shapes.
- Categorical variables are inserted as arbitrary integer codes.
- Too many weak features make distance less informative.
These limits explain why elbow and silhouette scores are necessary but insufficient. The final result still needs feature-level inspection and a business interpretation.
The output of this analysis is a set of descriptive profiles, not a prediction of who will buy insurance. If the goal changes to predicting purchase propensity, the cluster profile may become an exploratory feature, but it does not replace a supervised model and an out-of-sample evaluation.